Using the Quality Monitor Service
- Launch the SDI Portal application.
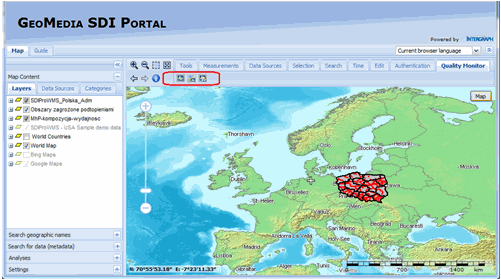
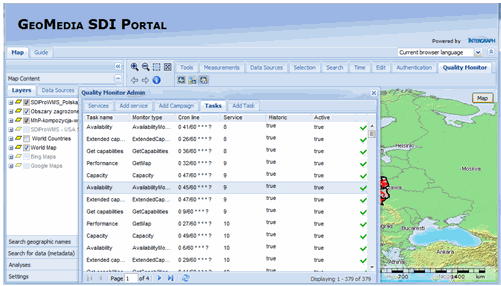
The Quality Monitor tab has three icons:
- Quality Monitor data window – Client view grid
- Quality Monitor map layer – Client view map
- Quality Monitor admin window – Admin view
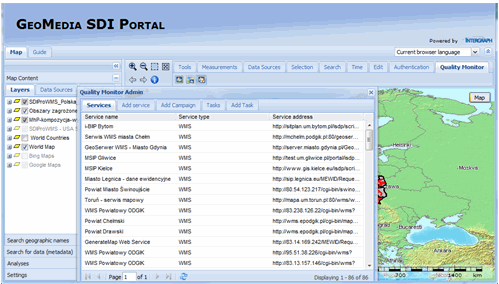
- Open the Quality Monitor Admin window.
- Click the Add service tab.
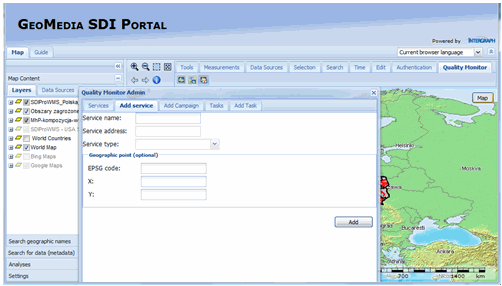
- Provide the following:
- Type the Service name.
- In Service address, type the URL with no spaces. The URL must be the same as for the SDI Portal (so do not use ?request=GetCapabilities, for example).
- Provide the Service type (WMS).
- Provide the geographic points of the geographic location of this service.
- Click Add. The service is visible on the services grid.
- Click the Add Campaign tab.
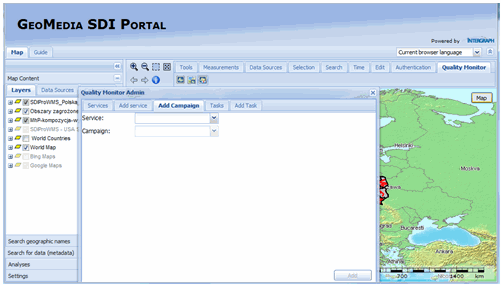
- In the Service field, select a previously created service name.
- In the Campaign field, select InspireViewServiceCampaign.
- Click Add. Three new tasks appear on the tasks grid: Availability, Performance, and Capacity.
- In the Add Task tab, add a single task.
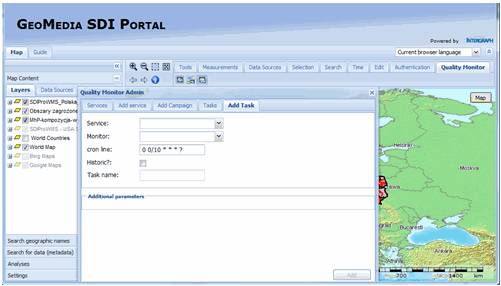
- Select the Service.
- Select the Monitor.
- Type a Task name.
If the Historic? flag is marked, the quality monitor framework will perform additional computations for each execution using previous execution result and details. Currently implemented computations rely on counting how many times each execution result value occurred in the past.
- Depending on the monitor type, some additional parameters can be provided.
- Click Add. A new task is visible on the task grid.
After scheduling a task, the first results are available according to the Portal settings, so results may not appear immediately.
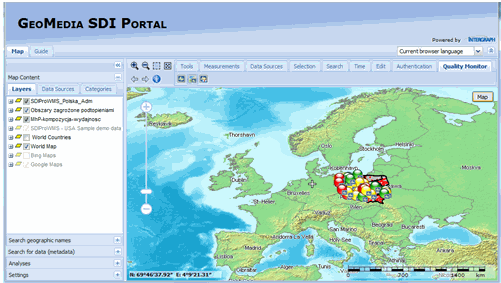
- Open the User view.
- Enable the map layer by clicking the middle icon: Quality Monitor map layer.
- Open the Last execution summary grid window. The following is an example:
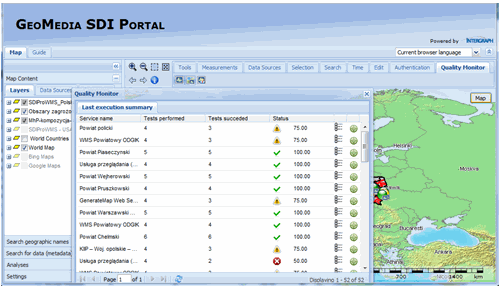
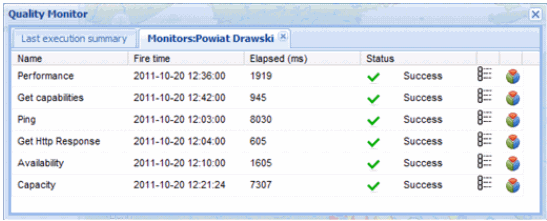
- The summary tab presents information on how many monitors succeeded and how many were executed. Every last execution of each task is counted.
- Center the map to the point defined when adding the map service. If you click the green cross-hair icon, the map view will be adjusted according to the geographic location of this service (see Step 4d in this section).
- Click the Details icon to see the summary of tasks for the given service. Results for each task, such as Capacity, Performance, and Availability, will be displayed. More detailed information can be accessed in the same way for the given task. Such comprehensive information may contain task parameters, validation reports, and all query parameters used.
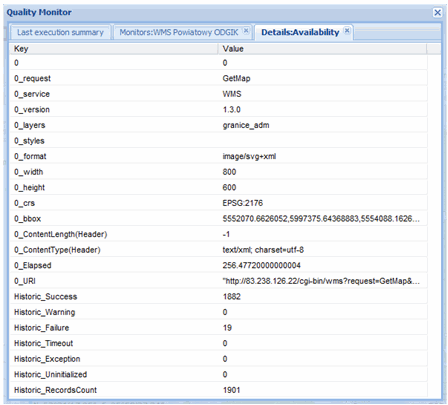
- A simple pie chart presents what is marked as "Historic" in Details. It counts the occurrences of each result value.
- Enable the map layer by clicking the middle icon: Quality Monitor map layer.
| Top of Page |